Ten Win Breakthrough Profiles: Nothing Fundamentally Changed
Sometimes ten wins just come and go with no explanation
Time for Part 2 of my series on Ten Win Breakthrough Profiles.

Remember, the pivotal event in this story is the ten-win breakthrough season, defined as the school's first ten-win season in at least a decade. I'm not looking at what effect the coach had. It's entirely about what happened before and after the ten-win breakthrough season.
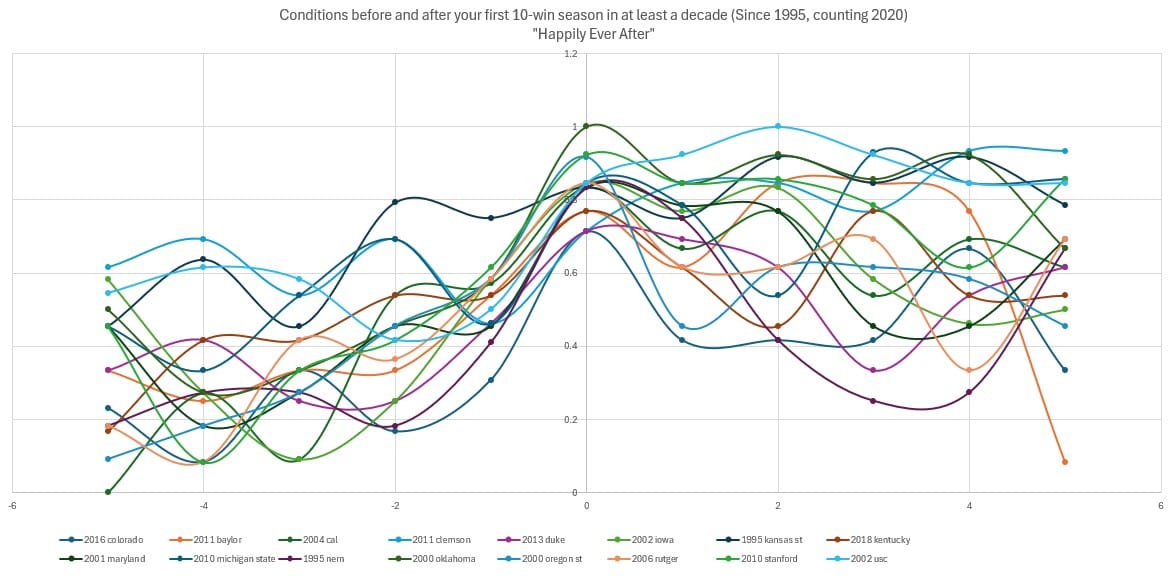
Before I get to the next category, I want to correct an omission: Gary Barnett's 1995 Northwestern Wildcats won ten games and the arc of their journey before and after that season qualifies as Happily Ever After, as their 5-year winning percentage increased by 78.7%. I assume I ignored it because it was nerncats football. Here's what the graph looks like with that year added:
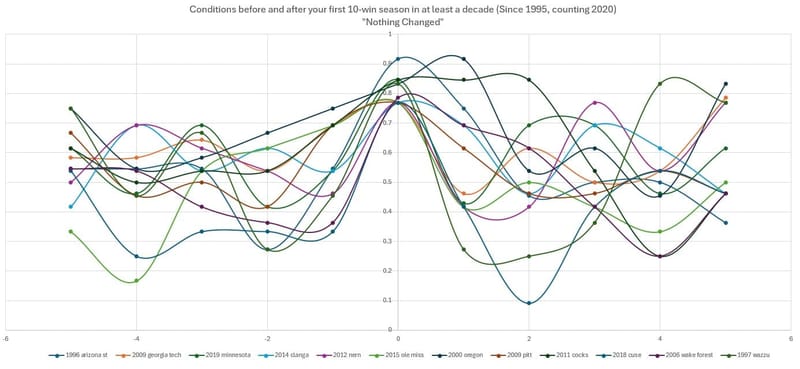
This next category is not quite as neatly defined. While my criteria were easily explicable, there was...tremendous variance among the results. I decided to define "Nothing Fundamentally Changed" as breakthrough seasons where the school's winning percentage changed by less than 10% in the five years after versus the five years before.
The poster child for this just happens to be Mike Bellotti's 2000 Oregon team, which notched the first 10-win campaign in school history. It's not that Bellotti didn't fundamentally change Oregon football, but he was well-established there when they had their breakthrough. So it's not that Bellotti didn't change Oregon football, it's that they didn't really build to stratospheric heights on the back of that 10-win season. Though they experienced two more 10-win years in the 5-year period after 2000, they were already a winning program. The run of success following the breakout brought them from a .659 program to a .672 program, an improvement of 2%. Between the two extra 10-win seasons, they won 20 games in three seasons to bring that average down.
Whenever that magical 10-win breakthrough happens, it feels like a signal that this team has arrived and this is the way it's going to be from now on. In the Happily Ever After scenario, that's what happened. In the Nothing Fundamentally Changed scenario, I wanted to capture stories where it was just the same after. An example of what I was looking for was Paul Johnson's 2009 Georgia Tech team. They won ten games, but never stopped being Paul Johnson Georgia Tech. In the 11 years surrounding that season (including the season itself), there was only one more 10-win season (in 2014), but the Yellow Jackets didn't really stray too far from the 7-win baseline.
On the other hand, 2006 Wake Forest, 2018 Syracuse and 2015 Ole Miss are all on here, and those seasons are perhaps better described by a different category (Flash in the Pan). Jim Grobe, Dino Babers and Hugh Freeze took losing programs to 10-win breakthroughs that changed them into losing programs with slightly different records.
When Dan Mullen and Steve Spurrier had their breakout seasons at Misssissippi State and South Carolina, they'd already been at those jobs for a while. The breakouts were culminations of marked improvements they'd made on the job. Mullen won 9, 6 and 9 before being hired away; two lackluster seasons by Joe Moorhead brought the improvement down to 4.4%. For Spurrier, his 2011 campaign was the first of three 11-2 seasons, but the program fell off in a hurry. After a 7-win season, the Head Ball Coach retired on a Tuesday in early October during what would become a 3-9 disaster. Adding Will Muschamp's 6-7 debut meant the net effect of that 2011 breakthrough was a 2% improvement in winning average.
Bruce Snyder's 1996 Arizona State team was the culmination of a rebuild that didn't end up having the juice past 1997. They survived '97 without Jake Plummer to the tune of 9-3, but a 5, 6 and finally 3-win season doomed Snyder to a firing.
P.J. Fleck's 2019 breakout season makes this list due to the 3-4 COVID season. Eliminating that data point changes the win percentage delta from 6% to 13%. Wiping out 2020 also brings Mike Leach's 2018 breakthrough at Washington State into this category. It is by no means the most bizarre Washington State incident in this list.
Let's talk about the Pittsburgh Panthers. In 2009, fifth-year head coach Dave Wannstedt built on the 9-4 campaign from a year prior to finish 10-3 for Pitt's first season with double-digit wins since the Dan Marino era. He followed that up with eight wins in 2010, and by the end of that season he'd been pushed out of the job. He didn't suffer the shame of a firing, but the "separation" was not his decision. 27 wins in three years AND a big mustache with a Yinzer accent was not enough for Pitt, who was clearly aiming for more than Wannstedt was providing.
They hired Tulsa's Todd Graham, who went 6-6 and was hired away by Arizona State. He was replaced with Wisconsin OC Paul Chryst, who won 19 games in three years (never more than 7 in one season) before being hired away by Wisconsin. After firing Wannstedt for an 8-win season, they had their next two coaches hired away without seeing 8 wins in a year again.
I still don't quite get what happened there.
After quite some time at Northwestern, Pat Fitzgerald returned much of a 6-win team to surge to 10 wins (including a bowl win) in 2012. He followed this up with a pair of 5-7 seasons that were capped off with a loss to Tim Beckman with a bowl on the line. After perusing much of this data, I found that a strong indicator of being fired following a 10-win breakout is a losing record the next year. Nevertheless, Padraig O'Horseteeth recovered with not one but two 10-3 seasons in 2015 and 2017. But nobody's ever done wild variance quite like our final data point.
1992 was the first winning season for fourth-year Washington State coach Mike Price, who had rebuilt a program that fell apart after Dennis Erickson's departure. '93 saw just 5 wins, but eight wins followed in '94. The '95 Cougs finished 3-8 however, and the improvement in '96 was modest to the tune of 5-6.
In 1997, however, the Cougs came out of nowhere to make the Rose Bowl behind star quarterback Ryan Leaf. Once again, Mike Price had arrived!
It took three full seasons for Wazzu to get their next ten wins. They went from 10-2 to 3-8 with an 0-8 PAC-10 record. 3-8 followed again, with 4-7 coming in 2000. The Cougs were in a death spiral.
Actually, no they weren't. They went 10-2 in 2001 and then went back to the Rose Bowl in 2002 with another 10-win record. Let's go back over this: in a decade and change, the win totals per season were 9, 5, 8, 3, 5, 10, 3, 3, 4, 10, 10.
None of that was anywhere near as entertaining as what Price did at his next job as head coach of Alabama:

Anyway, the graph for this category is below. Find the one and only Mike Price.

Next up: Jury's Still Out